Product overview

What you will get in MS Excel course

  1. You will get 170 topics ranging from basic to advanced containing text,videos and practice sessions.
  2. 17 set of in application assessments containing around 100 practical tasks.
  3. 16 macro based questions.
  4. 4 set of in application assessments and 1 set of multiple choice quiz at the end of course.
  5. It also has list of shortcuts which you can use to increase productivity in Excel.

Complete topic listing

Excel is used to create spreadsheets. In this chapter you will learn basics of excel document like creating a new spreadsheet, creating a document using existing template, changing the color theme of excel, printing etc -

  1. change color scheme of excel
  2. close and excel document
  3. create a document from template (billing statement)
  4. create a new blank document
  5. in app assessment
  6. open an excel document
  7. save an excel document to a new name
  8. save an excel document
  9. using microsoft excel help

When you find yourself repeatedly performing the same actions or tasks in a spreadsheet, macro will be useful. A macro is a recording of each command and action you perform to complete a task. Whenever you need to carry out that task just run the macro instead -

  1. How to record a macro
  2. How to view and run a existing macro
  3. How to save a macro to use in all documents
  4. How to edit a macro

Excel's format options include conditional formatting, number formatting, and text and cell formatting. You will learn how to apply formatting techniques such as align text, apply background color to text, apply fill effect etc -

  1. add a predefined cell border
  2. create a custom cell border
  3. draw border grid in cells
  4. remove cell border
  5. align text
  6. change color of text
  7. apply fill effect to background color
  8. apply pattern to background color
  9. change background color of text
  10. watermark from wordart
  11. hide a row
  12. hide gridlines

This covers basic information for entering data into Excel. You will also learn how to select single and multiple data using mouse and keyboard-

  1. enter the data
  2. select single cell using keyboard
  3. select range of cells using keyboard
  4. select range of cells using mouse
  5. select entire row and column
  6. select non adjacent cells
  7. find cells with formulaes

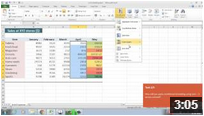
By applying conditional formatting to your data, you can quickly identify variances in a range of values with a quick glance. You can show data in color scale to differentiate high, medium, and low values -

  1. formatting
  2. formatting using data bars
  3. formatting using icon set
  4. formatting using two color scale
  5. formatting using three color scale
  6. formatting of top items
  7. same conditional formatting
  8. conditional
  9. clear conditional formatting

On a worksheet, you can enter simple formulas to add, divide, multiply, and subtract two or more numeric values. Once you have created a formula, you can fill it into adjacent cells — no need to create the same formula over and over again -

  1. what is formulae
  2. how to write formulae - type inside cell
  3. how to write formulae - formula bar
  4. how to write formulae - cell reference
  5. cell references
  6. why use cell references in formulae
  7. relative and absolute
  8. arithmatic operators
  9. names in formulas
  10. show formulae
  11. Prebuilt arithmatic functions
  12. Perform multiplication and fill
  13. Apply formulas on many cells at once
  14. How to correct errors in formulas

A sparkline is a tiny chart in a worksheet cell that provides a visual representation of data. Use sparklines to show trends in a series of values, such as seasonal increases or decreases, economic cycles, or to highlight maximum and minimum values

  1. how to insert sparklines
  2. how to change style of sparkline
  3. how to change type of sparkline
  4. how to add high point and low point in sparkline

Excel's Logical Functions can be used to introduce decision making into your spreadsheet.Excel provides a large selection of Statistical functions. This will help to perform common calculations to complex statistical distribution and probability tests -

  1. Students in a class - COUNTA
  2. Number of blank cells - COUNTBLANK
  3. Student eligible for exam - COUNTIF
  4. Students based on multiple criteria - COUNTIFS
  5. Railway concession eligibility - OR
  6. Pass Fail status - IF, AND
  7. Marks Division - Nested IF, AND

To extract specific information from large volume of data, you can create a PivotTable — a table that extracts, organizes, and summarizes your data. You can use this to analyze the data, make comparisons, detect patterns and relationships, and discover trends -

  1. Create pivot table
  2. Filtering data in pivot table
  3. Create pivot chart
  4. Filtering data in pivot chart
  5. Switching row and column in Pivot chart
  6. Hide the Grand total row,column in pivot table
  7. Summarising the values in different forms in pivot table
  8. Using slicer to filter data

Excel provides many file management functions such as checking compatibility with older versions, enabe auto recover, mark as final so that file cannot be changed, recover unsaved versions etc -

  1. change document properties
  2. check compatibility with older versions
  3. enable auto recover
  4. enable recover unsaved versions
  5. recover unsaved files
  6. mark as final

You can turn a range of cells into a table. A table typically contains related data in a series of worksheet rows and columns that have been formatted as a table. You can then manage the data in the table rows and columns independently from the other data -

  1. Creating a data table
  2. Table view customization
  3. Converting table to normal data range
  4. Sorting by alphabetical
  5. Multiple column sorting
  6. Filter to find the required data
  7. Grouping data
  8. Creating summary report
  9. Importing text data from outside source

Excel's Math Functions can be used to perform common mathematical operations such as addition (SUM function), multiplication (product function), and rounding numbers (ROUND function).Excel's Lookup Functions can be used to simplify finding specific entries in a data table -

  1. Price to pay by client- ROUND
  2. Buses needed for school - ROUNDUP
  3. Students left after seat allocation - MOD
  4. Price of one product among many - SUMIF
  5. Price of product variant among many - SUMIFS
  6. Total of range - SUMPRODUCT
  7. Product discount - VLOOKUP
  8. Tax rate - approx VLOOKUP
  9. Bonus for employees - exact VLOOKUP
  10. Shipping tax - HLOOKUP
  11. Monthly sales for store - INDEX , MATCH
  12. EMI to be paid - PMT

In Microsoft Office, you can use passwords to help prevent other people from opening or modifying your documents, workbooks, and presentations. It's important to know that if you don't remember your password Microsoft can’t retrieve your forgotten passwords

  1. create a signature and sign digitally
  2. selected action
  3. protect the document with password
  4. restrict changes

Excel's Text Functions help you manage the text data in your spreadsheets. There are a number of date functions available in Excel. Depending on your needs, you can use a date function in Excel to return the current date, the current time, or the day of the week -

  1. Number of letters types - LEN
  2. Join first and last name - CONCATENATE
  3. Employee age - TODAY
  4. Day, Month, Year - DAY, TEXT, MONTH, YEAR, EOMONTH
  5. Find word in paragraph - SEARCH
  6. Get area code and ph number - LEFT, RIGHT
  7. Employee work experience - DATEDIF

Using the Cut, Copy, and Paste commands in Microsoft Excel, you can move or copy entire cells or their contents. You can also copy specific contents or attributes from the cells. For example, you can copy the resulting value of a formula without copying the formula itself -

    1. copy cell formatting
    2. copy formulaes
    3. copy values not formulaes
    4. Insert moved or copied cells between existing cells
    5. Move or copy cells and cell contents
    6. merge and center
    7. wrap text
    8. copy visible cells only
    9. Copy cell width settings

Charts are visual representations of worksheet data. Charts often makes it easier to understand the data in a worksheet because users can easily pick out patterns and trends illustrated in the chart that are otherwise difficult to see -

  1. insert a chart
  2. add data label to chart
  3. link the title to worksheet cell
  4. change the name of chart
  5. apply predefined chart style
  6. change chart type
  7. change layout of column chart
  8. change style of chart area
  9. show legend at top
  10. add secondary vertical axes to chart
  11. change display of secondary vertical axis
  12. remove a secondary vertical axis
  13. move a chart to new sheet
  14. move a chart as object in new sheet
  15. save chart as template

By using what-if analysis tools, you can use several different sets of values in one or more formulas to explore all the various results.For example, you can specify a result that you want a formula to produce, and then determine what sets of values will produce that result -

  1. Goal Seek_Loan
  2. Goal Seek_Breakeven
  3. Goal Seek_Profit
  4. loan amount and EMI - one variable data table
  5. loan amount and multiple parameters - one variable
  6. emi chart - two variable data table
  7. parameters and plant indicators - two var
  8. sensitivity analysis - conditional formatting
  9. Scenario Manager - career options
  10. Scenario manager - sales
  11. Setting up solver
  12. Solver - product mix
  13. Remove Duplicates
  14. text to column

Excel worksheets don’t always look great on paper because they’re not designed to fit on a page—they’re designed to be as long and wide as you need them to be. Using several techniques you can make them look good when they are printed -

  1. change the page orientation to landscape in the worksheet
  2. Change the page orientation when you are ready to print
  3. insert page number and date in custom header and footer
  4. preview worksheet pages before printing
  5. set page margins
  6. print a file
  7. print only selected parts of sheet
  8. save a file as PDF

Contact Now

Realize your Ideas with us.

Call us today: +97143864002/+97167011555
Email us: info@odriantech.com